Commercial Operating System

From market clarity to repeatable growth.

Six interconnected components of a commercial operating system, built for healthtech. Each one governs a distinct function. Each one produces a tangible output. None of them work in isolation, and together they form the system I use to diagnose gaps, establish priorities, and build the foundation for durable growth. Underneath all of them sits a measurement layer that tells you whether the system is working.

The six components
01 Market GTM Framework 02 Investment Growth Allocation Model 03 Revenue Revenue Bridge 04 Focus ABM & Segment Scoring 05 Motion Lead Management SOP 06 Brand Brand Experience Model
Measurement Layer
Budget and Attribution Model
Not a step. The infrastructure that runs across all six components and tells you whether the system is working.
01GTM Architecture

GTM Framework

The commercial system that connects market insight to revenue execution

Signal: Close rate ≥ 20%
Use when
Entering a market, launching a product, or resetting growth after a stall
Leadership decision
Where and how will we compete?
What it produces
An aligned GTM architecture with tested ICP, positioning, channels, and launch design
Signal it's working
Close rate at or above 20%, confirming ICP and positioning rather than just generating activity
GTM Framework
Understand · Evaluate · Plan · Implement and Measure
01
Understand
Market, buyer behavior, ICP definition, decision process, alternatives
⚠ Most failures start here. Leaders skip this phase.
02
Evaluate
Segmentation, pricing model, competitive positioning, product-market fit signals
03
Plan
Channel mix, launch design, sales enablement, partner strategy
04
Implement + Measure
Execution, adoption tracking, close rate, pipeline velocity, iteration
Signal Metric Close rate ≥ 20% confirms ICP and positioning are working, not just generating activity

I do not treat go-to-market as a launch checklist. I treat it as the commercial system that connects the market to the business. My framework moves through Understand, Evaluate, Plan, and Implement-Measure, linking segmentation and buyer insight to product choices, pricing, channels, launch design, and adoption.

The sequence matters because most GTM failures are already in motion before anyone starts executing. Leadership often skips Understand, assumes it knows the customer, and jumps straight to messaging, campaigns, or sales enablement. I slow that moment down long enough to test the ICP, the buying problem, the decision process, and the alternatives customers are actually weighing.

When that foundation is right, execution gets simpler and the conversations get sharper. I look for close rates at or above 20 percent as one practical signal that the ICP and positioning are genuinely working.

Where Failures Originate
The Understand phase
Leaders skip it. By the time execution stalls, the error is two phases back.
Signal That It's Working
Close rate ≥ 20%
Confirms ICP and positioning, not just pipeline activity.
02Investment Strategy

Growth Allocation Model

Making investment tradeoffs explicit across three growth horizons, and getting the ratios right

Target: 10:1 fully-loaded MROI
Use when
There are more growth opportunities than budget or capacity, and investment decisions are made by momentum rather than evidence
Leadership decision
Where should the next dollar and hour go?
What it produces
A defensible growth investment portfolio with explicit tradeoffs across Accelerate, Penetrate, and Explore horizons
The counterintuitive part
Penetrate gets more budget than Accelerate, even though Accelerate delivers more of the growth target. Most organizations get this backwards.
Growth Allocation Model
Where to concentrate investment across growth horizons
Accelerate
~35% budget · ~70% of target
Proven economics. Efficient to win. Hold to 10:1 fully-loaded MROI.
Target Benchmark
10:1 fully-loaded MROI
Penetrate
~60% budget · ~30% of target
Building new pipe is expensive. Brand, education, ABM, longer cycles. This is the investment horizon.
Explore
Explore · ~5%

I use the Growth Allocation Model to solve a problem I see repeatedly in growth-stage companies. The constraint is usually not ideas. It is concentration. And when organizations do concentrate, they often concentrate in the wrong place.

The counterintuitive reality is that Penetrate requires more investment than Accelerate, even though Accelerate delivers more of the growth target. Accelerate is efficient: you are winning in markets where the economics are already proven, and the 10:1 fully-loaded MROI standard is achievable. Penetrate is investment: you are building new pipe in segments that require more education, longer cycles, brand credibility, and ABM motion before they produce. Starving Penetrate to over-fund Accelerate is how growth-stage companies wake up one day with no next engine.

Explore is not zero. It is a deliberate 5 percent reserved for market intelligence, proof of concept work, and early-stage signal. Without it, you have no systematic way to know when to graduate something from unknown to investable. Decision gates govern movement between horizons based on evidence, not enthusiasm.
Accelerate Horizon
~35% of investment
Proven economics. Delivers ~70% of growth target. Hold to 10:1 fully-loaded MROI.
Penetrate Horizon
~60% of investment
Delivers ~30% of growth target. This is the investment horizon. Most orgs underfund it.
Explore Horizon
~5% of investment
Not zero. Deliberate. Market intelligence and POC to inform the next Penetrate decision.
03Revenue Planning

Revenue Bridge

Connecting the growth target to marketing's role in each revenue component

Signal: Marketing pipeline contribution %
Use when
Growth targets exist without a credible path to revenue, or marketing's role in hitting the number is undefined
Leadership decision
Where will revenue come from, and what is marketing responsible for in each component?
What it produces
A component-level revenue plan with explicit marketing ownership across new acquisition, expansion, retention, and adjacency
The discipline
One heroic bet rarely carries a year. Breaking the target into components forces a real conversation about where growth will actually come from and what marketing will do in each place.
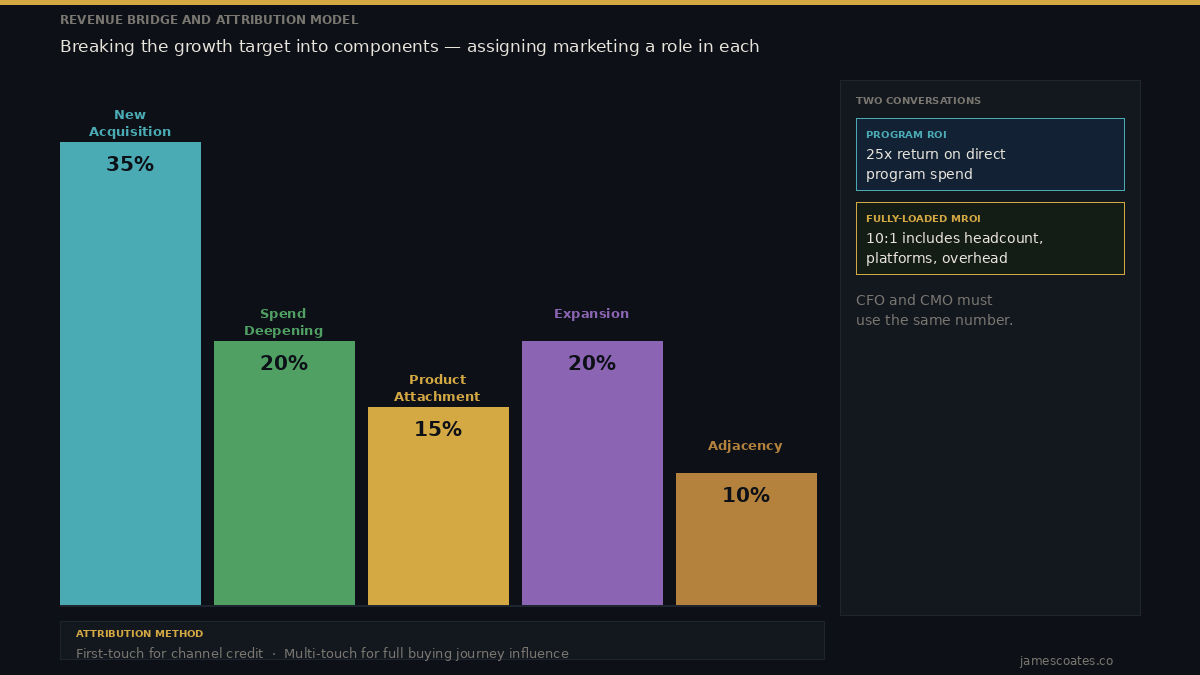
Revenue Bridge waterfall chart: New Acquisition 35%, Spend Deepening 20%, Product Attachment 15%, Expansion 20%, Adjacency 10% Tap to expand

I use the Revenue Bridge to make the growth target concrete before anyone runs a program. I start with the number and break it into its underlying sources: new customer acquisition, spend deepening, product attachment, expansion into adjacent segments, and retention. Each component gets a specific marketing role and a measurable contribution target.

The value is in forcing the conversation. Most teams skip from "we need to grow 40 percent" to "here is our campaign plan" without asking where that growth will actually come from. The bridge makes that gap visible. It also surfaces the mix problem: companies that over-index on new acquisition while ignoring expansion are usually leaving their fastest-return dollars on the table.

The bridge is a planning tool. It tells you where to point resources before the year starts. Measuring whether you hit those targets is a different job, and it belongs in the next framework.

New Acquisition
Net new logos
Highest cost, longest cycle. Needs the most marketing investment per dollar of revenue.
Expansion and Deepening
Installed base
Lower cost, shorter cycle. Most companies underfund this relative to the return it produces.
The Mix Question
Before the plan
Getting the revenue mix right is the first decision. Everything else flows from it.
04Account-Based Growth

ABM and Segment Scoring

Five dimensions that determine which accounts get the spear, not the net

Principle: Expansion > Acquisition
Use when
The addressable market is broad but resources are constrained and coverage is too thin
Leadership decision
Which segments and accounts deserve concentration?
What it produces
A prioritized market and account model with buying committee maps and sequenced outreach
Key insight
Expansion economics beat acquisition economics. The fastest growth is often already inside the customer base.
ABM and Segment Scoring
Five scoring dimensions. Weighting determines where the spear points.
Financial Value
90
Operational Pain
85
Multi-Product Potential
72
Sales Velocity
68
Reachability
78
Key Insight

Fastest growth is often already inside the customer base. Expansion economics beat acquisition economics.

Output

Priority account list with buying committee map, entry point, message, and outreach sequence.

I use ABM and segment scoring when a broad demand model is too blunt for the opportunity. Traditional demand generation casts a net. ABM is a spear, and I want to point it where the probability and value are highest. I score accounts against financial value, operational pain, multi-product potential, sales velocity, and reachability.

That lets me prioritize not just the right company, but the right buying committee, entry point, message, and sequence. It also keeps expensive account programs from becoming a polished version of untargeted outreach.

I have found that the fastest growth opportunity is often already inside the customer base. Expansion economics are fundamentally different from acquisition economics because there is an installed relationship, observed usage, and a clearer path to value.

Scoring Dimensions
5-factor account model
Financial value · Operational pain · Multi-product · Sales velocity · Reachability
Key Insight
Expansion beats acquisition
Installed relationship, observed usage, clearer path to value.
05Revenue Operations

Lead Management SOP

Making the marketing-to-sales handoff a system, not a relationship

Signal: Stage conversion rate by segment
Use when
Marketing activity isn't consistently becoming pipeline, or the handoff depends on individuals rather than a system
Leadership decision
How will demand move reliably across marketing and sales?
What it produces
An enforceable lead management system with defined stages, SLAs, ownership, and scoring thresholds
Watch this number
Stage conversion rate by segment. When MQLs from a segment don't convert to opportunities at the same rate, that is a system signal, not a volume problem.
Lead Management SOP
Lifecycle stages, ownership, and SLAs. The process shouldn't depend on who's in the room.
Inquiry
Raw inbound, any channel
24h response
MQL
Score threshold met
4h routing
SAL
BDR qualified, accepted for outreach
Same-day accept
SQL
BDR confirmed fit, passed to AE
2-day qualify
Closed
Won or Lost, tracked
Track all
Owner
Marketing
Owner
Marketing
Owner
Marketing / Sales (BDR)
Owner
Marketing / Sales (BDR)
Owner
Sales
Watch This Number
MQL → Opportunity conversion  ·  Weak conversion exposes source quality, scoring, routing speed, and sales acceptance, without a blame conversation

I build a lead management SOP because the last mile of GTM is where many otherwise capable commercial systems break down. Marketing and sales can have strong people, a useful product, and plenty of demand, then still lose momentum in the handoff. I define lifecycle stages, ownership, service-level agreements, scoring thresholds, routing, and follow-up expectations so the process does not depend on a relationship between two individuals.

MQLs are not an outcome. They are a program health indicator. Volume tells you whether top-of-funnel programs are running. Stage conversion rate by segment tells you whether the system is working. When MQLs from a particular segment stop converting to opportunities at the same rate as others, that is a system signal: source quality, qualification criteria, routing speed, SDR acceptance, or nurture logic is breaking somewhere. The SOP makes that break findable without turning the review into a debate over anecdotes.

The output of this framework is pipeline velocity and handoff integrity, not MQL count. A system that converts at 15 percent is worth twice the investment of one converting at 6, regardless of how many MQLs sit at the top.
Primary Signal
MQL → Opportunity conversion
Weak conversion is diagnostic, not a blame conversation.
SLA Coverage
Every stage has a clock
24h inquiry response · 4h MQL routing · Same-day SAL accept
06Brand Architecture

Brand Experience Operating Model

Governing the brand promise across every touchpoint, not just communications

Principle: Product = Brand
Use when
Positioning and customer experience are beginning to diverge, or brand is treated as a communications function rather than an operating one
Leadership decision
How will the company consistently deliver on its promise across every touchpoint?
What it produces
An operating model connecting brand, product, sales, and customer experience, with measurable outcomes: win rate on branded deals, pipeline velocity on named accounts, and customer advocacy rate
The risk
Companies that treat brand as communications-only eventually discover their product experience is contradicting their positioning. By then it's embedded and costly.
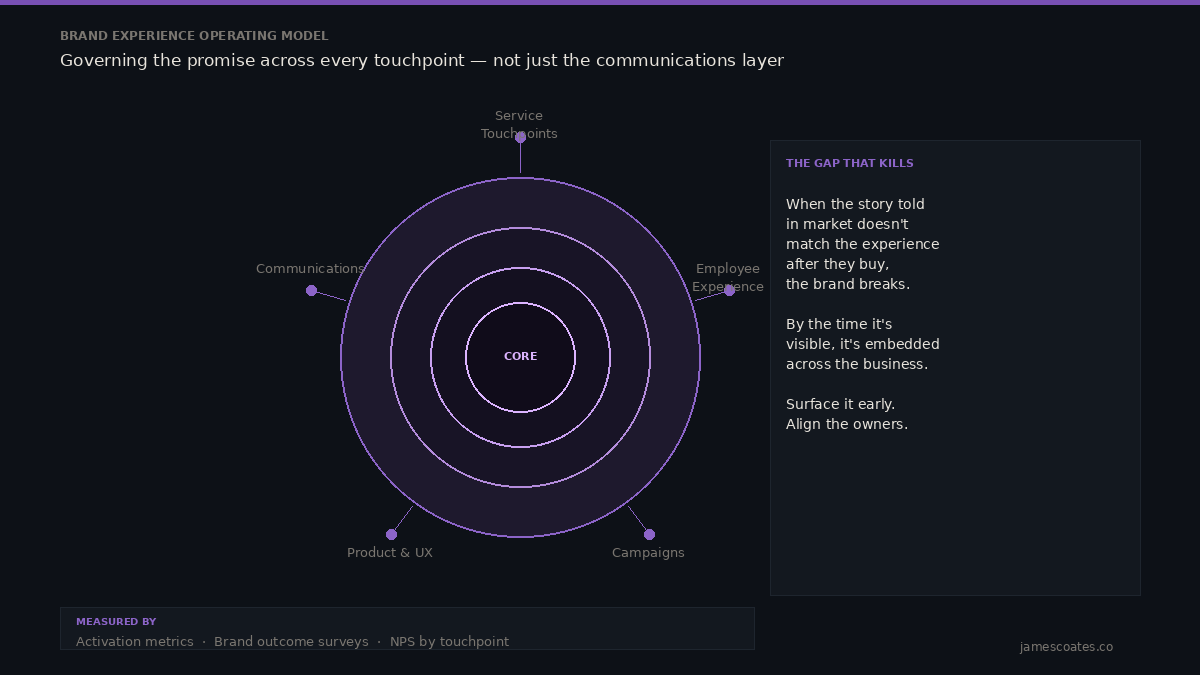
Brand Experience Operating Model, concentric rings from core promise outward through all touchpoints Tap to expand

I treat brand as the end-to-end experience of the promise, not a design exercise or a communications layer added at the end. The Brand Experience Operating Model gives me a way to govern that promise across communications, product and UX, service touchpoints, campaigns, and employee experience. I measure activation and brand outcomes, so brand is connected to behavior rather than confined to preference studies.

I use the model to find the gaps customers feel when the story told in market does not match the experience delivered after they buy. Companies that treat brand as communications-only eventually discover that their product experience is contradicting their positioning. By then, the inconsistency is embedded across the business and costly to fix.

I would rather surface those tensions early, align the owners, and make the promise recognizable in every meaningful interaction.

The Gap That Kills
Market story vs. post-sale experience
By the time it's visible in data, it's embedded across the business.
Measured By
Activation + brand outcomes
NPS by touchpoint · activation rate · brand preference vs. competitor
Measurement Layer

Budget and Attribution Model

Not a step in the process. The infrastructure that runs across all six components and tells you whether they are working.

25x program ROI · 10:1 fully-loaded MROI
Use when
You are standing up a commercial system and need measurement infrastructure from day one, or you are inheriting one where ROI conversations rely on competing numbers and no one can agree on what the budget actually produced.
Leadership decision
How do we build the measurement layer so that investment decisions are always grounded in evidence, not defended after the fact?
What it produces
A multi-touch attribution map across the full account journey, three distinct ROI calculations, and a budget model the CFO and CMO can read from the same page
The discipline
MQLs and clicks are program health indicators, not outcomes. The outcomes are pipeline sourced, closed won attributed, and fully-loaded MROI. Each number belongs in a different conversation.
Attribution Model
Three layers. Three jobs. One model.
First-Touch
Pipeline sourcing
Where did the lead that became pipeline originate? Every dollar of spend is credited to the channel that sourced the lead first. This answers the sourcing question, not the credit question. It tells you where to invest to generate net-new pipeline.
Multi-Touch
Full journey map
Every program and dollar that touched a lead or contact across the full account journey, from first awareness to closed won. Not all contacts in an account are at the same stage. This shows where people engaged, where they did not, and where the gaps are. Program diagnostics live here.
Deal Return
True MROI
All spend that touched any lead in an account that closed, measured against the revenue that closed. This is the fully-loaded picture and the only number that survives a CFO or board conversation. It requires the full journey map to calculate correctly.
Program / Pipeline
25x target
Direct spend only. Channel efficiency. Fastest to calculate. Use internally for optimization decisions.
Program / Closed Won
More conservative
Direct spend against revenue that closed. The number a skeptical CRO will ask for first.
Fully-Loaded MROI
10:1 target
All costs against closed won. Headcount, platforms, overhead. The only number that survives a CFO or board conversation.

Attribution is not one number. It is three distinct layers doing three different jobs, and conflating them is where most ROI conversations break down.

First-touch tells you where pipeline originated. It credits the channel or program that sourced the lead that ultimately entered the funnel. This is a sourcing question, not a credit question. It tells you where spend generated net-new pipeline, which informs where to invest next.

Multi-touch maps every dollar across the full account journey. Not all contacts in an account are at the same stage. Someone in the buying committee may be in early awareness while a champion is already in negotiation. The multi-touch model shows where each person engaged and where they did not. This is where program diagnostics live. MQLs, clicks, and engagement rates are inputs to this layer. They tell you whether a program is working well enough to keep running, needs adjustment, or should be cut. They are not outcomes.

Deal return calculates all spend that touched any lead in a closed account against the revenue that closed. This is your true MROI. A 25x program return on pipeline and a 10:1 fully-loaded return can both be true at the same time. I want the CMO and CFO looking at the same model so the conversation is about choices, not competing calculations.

Fractional & Advisory

These frameworks are not separate from my fractional work. They are the tools I use to diagnose commercial gaps, establish priorities, and build the foundation an internal team or permanent leader can continue operating. When I engage with a company, these are the mechanisms I bring in as working systems the organization can run, not presentations left behind after an offsite.

Apply These Frameworks to Your Business →